Draw Cadence Influences Engagement Levels in Regulated Lottery Systems by Region
David Frank · Aug 26, 2026
Draw Cadence Influences Engagement Levels in Regulated Lottery Systems by Region
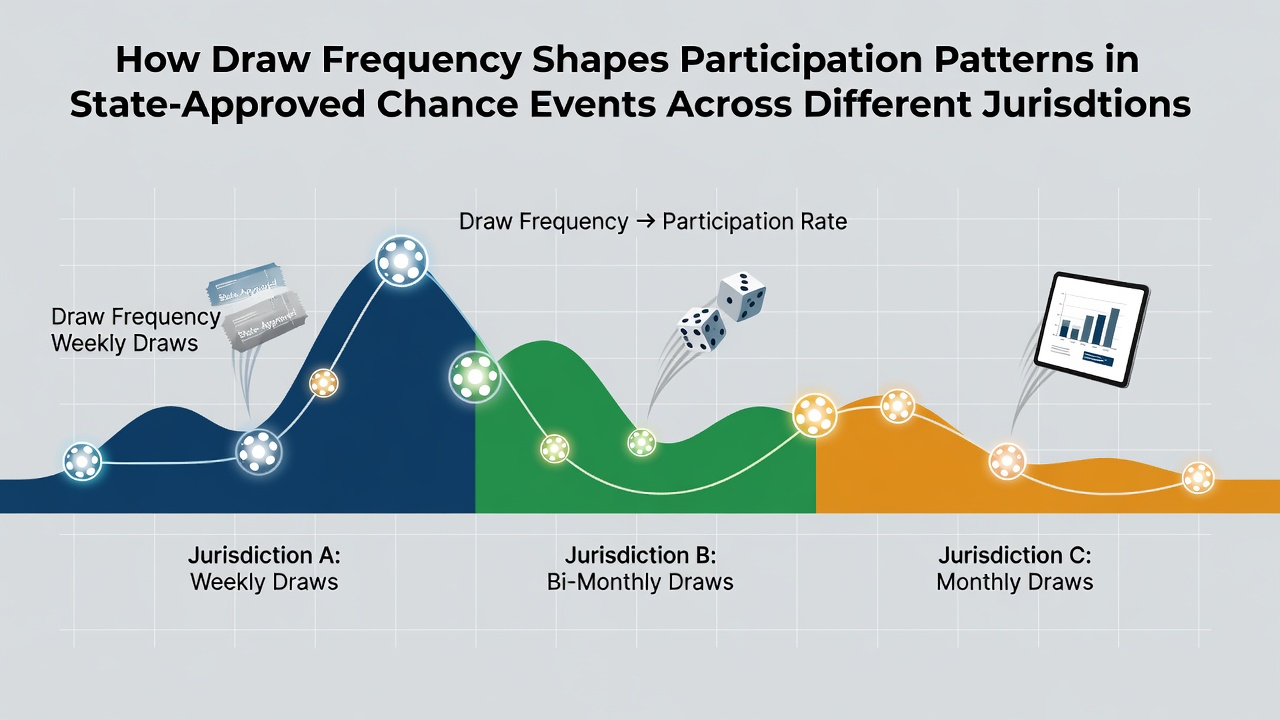
State-approved chance events such as lotteries operate under rules that set specific draw intervals, and these intervals directly affect how often participants purchase tickets along with overall engagement rates. Jurisdictions that schedule daily draws record higher repeat transaction volumes than those limited to weekly formats, according to data compiled by the North American Association of State and Provincial Lotteries. Researchers tracking ticket sales patterns note that shorter intervals create more frequent opportunities for play while longer gaps encourage larger jackpot rollovers that can temporarily spike interest.
Daily Versus Weekly Draw Structures in North American Markets
US state lotteries that run draws every day, including games like Pick 3 and Pick 4, generate steady participation across all days of the week, whereas Powerball and Mega Millions maintain weekly schedules that build anticipation through accumulated jackpots. Canadian provincial systems follow similar patterns, with Ontario and Quebec operating both frequent smaller-prize draws and less frequent high-stakes events, and figures from provincial gaming commissions show daily formats sustain baseline player activity even when jackpots remain modest. Those who study these markets observe that daily draws reduce the average ticket price per play, which broadens access for regular participants who prefer smaller, consistent wagers over waiting periods that stretch multiple days.
European and Australian Approaches to Draw Scheduling
European lotteries often combine frequent national draws with regional variants that run on different timetables, and data from the European Lotteries association indicates that countries maintaining three or more draws per week experience more stable revenue streams than those relying on single weekly events. Australian state-based operators such as those in New South Wales and Victoria schedule mid-week and weekend draws to capture commuter traffic and leisure spending periods, while research from university economics departments in Melbourne reveals that staggered frequencies help maintain participation across demographic groups that might otherwise disengage during long intervals. Observers note that these varied cadences allow operators to test how different player segments respond to timing without altering prize structures.
Participation Metrics and Revenue Correlations
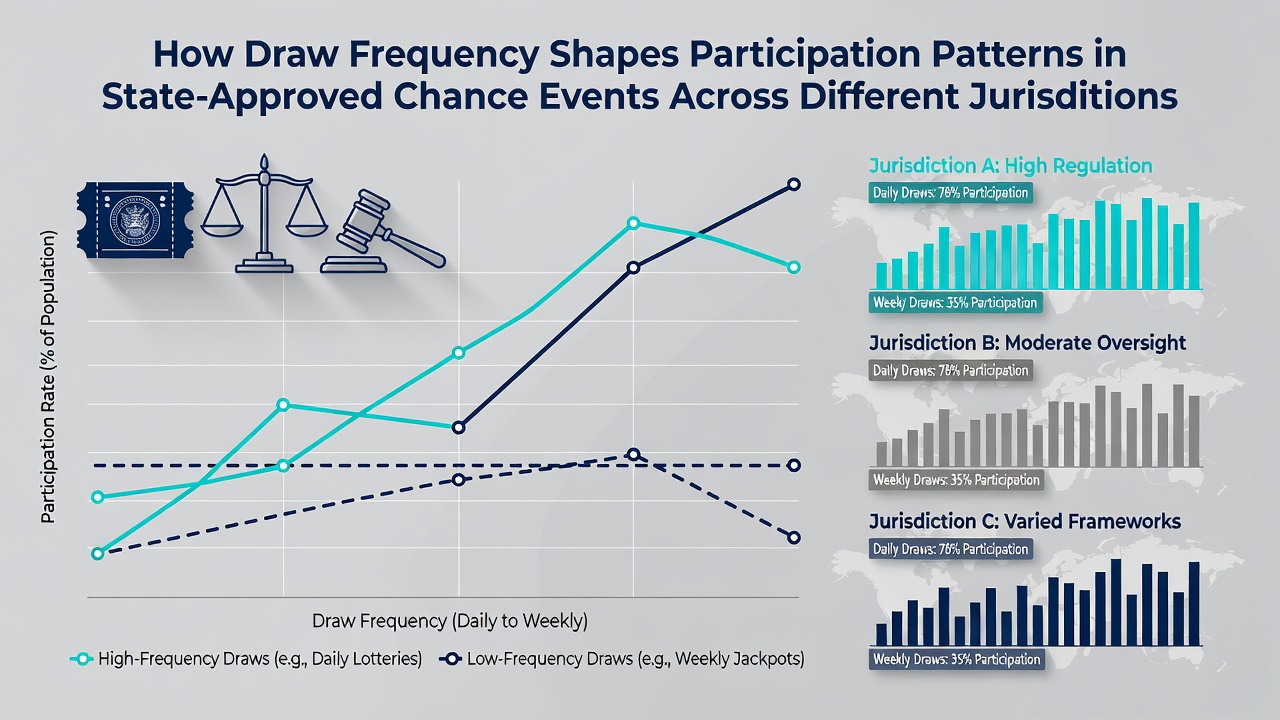
Statistical reviews of lottery performance across multiple jurisdictions demonstrate that draw frequency correlates with both transaction count and average spend per participant, yet the relationship varies by jackpot size and local economic conditions. In August 2026, several US states reported increased daily game sales following adjustments that added mid-week draws to existing schedules, and analysts at research institutions attribute the uptick to convenience rather than prize changes alone. Longer intervals between draws tend to concentrate activity around rollover announcements, which can produce sharp peaks followed by troughs in sales volume, whereas consistent daily or bi-weekly formats distribute activity more evenly and support predictable operational planning for retailers and regulators alike.
Jurisdictional Comparisons and Regulatory Adjustments
Regulators in different regions monitor participation data to determine whether altering draw frequency improves accessibility or inadvertently encourages excessive play, and reports from Canadian gaming authorities show that provinces introducing additional draw days saw measurable rises in active player accounts without corresponding increases in problem gambling flags tracked through voluntary self-exclusion programs. Australian operators have experimented with frequency changes tied to specific holidays or events, and industry association summaries indicate these targeted adjustments lift engagement temporarily while preserving overall market stability. Those who examine cross-border data find that jurisdictions balancing frequent low-stakes draws with occasional high-profile events achieve broader demographic reach than systems locked into single weekly cycles.
Player Behavior Patterns Across Frequency Regimes
Studies of ticket purchasing habits reveal that participants in daily-draw environments tend to establish routines around specific purchase times, such as morning commutes or evening convenience stops, while weekly-draw players often time their activity around jackpot announcements and media coverage. Data collected by academic teams at institutions in both North America and Europe shows that shorter intervals correlate with higher retention rates among casual participants who might otherwise forget or lose interest during extended waits. Regulators continue to review these behavioral indicators when evaluating proposals for new game formats or schedule modifications, and evidence from operational reports suggests that frequency serves as one lever among several that shape sustained participation levels.
Conclusion
Draw frequency functions as a structural variable that interacts with jackpot size, retail availability, and demographic factors to determine how state-approved lotteries maintain engagement across jurisdictions. Patterns documented in regulatory filings and industry reports illustrate that daily or near-daily schedules support consistent activity, whereas weekly formats generate episodic surges tied to prize growth, and operators in multiple regions continue to adjust intervals based on observed sales and participation data. These adjustments reflect ongoing efforts to align game mechanics with player preferences while complying with oversight requirements that differ by jurisdiction.